TL;DR
When your download speed is 10-30 Mbps and this is lower than expected you are probably using a Wi-Fi g connection. The maximum download speed with Wi-Fi g is 31.4 Mbps.
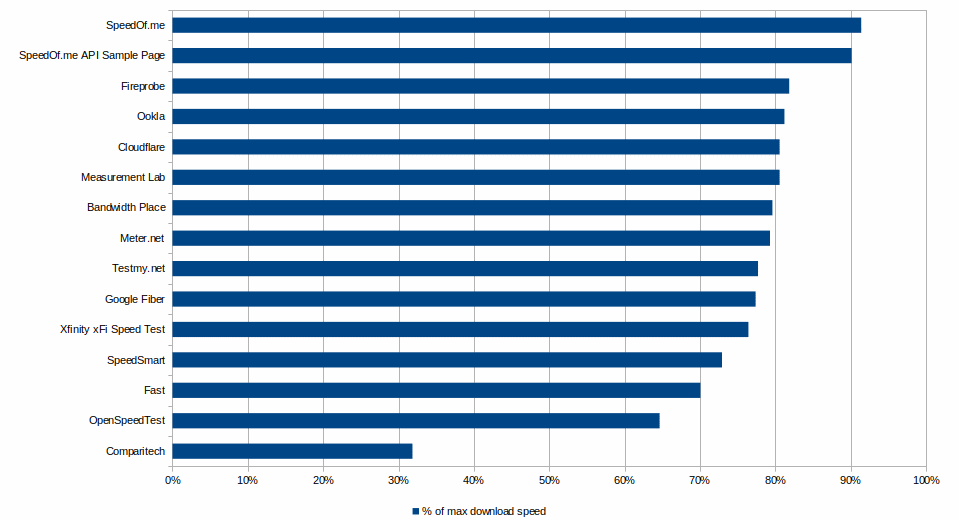
When you have a wired connection and Google Fiber and Xfinity xFi Speed Test measure a much lower download speed as expected, then your home network is the bottleneck.
When you have a Wi-Fi network or better and you measure 90% (or less) with Google Fiber and Cloudflare then your Wi-Fi network is the bottleneck.
Contents
Introduction
The results of the first ultimate home network test 2022 were so strange that a second extensive test was inevitable.
Method of measurement
For this test the home network has been reorganised. The old routers (Sitecom WL-303 Wireless Router 300N-XR and Sweex RO001) have been removed and are replaced by the TP-Link Deco M4 AC1200 Whole Home Mesh Wi-Fi System.
According to the specs the Deco M4 has 2× Gigabit ports and the following Wi-Fi speeds:
- 5 GHz: 867 Mbps (802.11ac)
- 2.4 GHz: 300 Mbps (802.11n)
With a download speed of 100 Mbps, as advertised by the ISP, this home network is certainly not the bottleneck.
The test configurations
For this ultimate home network test, download speeds are measured based on the following configurations:
- Optimal wired network
- Wired 100 Mbps
- Sweex RO001
- Sitecom WL-303 300N
- Icidu NI-707539
- Edimax BR-6208AC
- Wi-Fi n
- Sitecom WL-303 300N Wi-fi n 2.4Ghz
- Sitecom N600 X5 Wi-Fi n 2.4Ghz
- Icidu NI-707539 Wi-Fi n 2.4Ghz
- Edimax BR-6208AC Wi-Fi b/g/n
- Sitecom N600 X5 Wi-Fi g 2.4Ghz
Speed tests to test
For this speed test test we use the speed tests mentioned at the page Which speed tests to test plus the SpeedOf.me API Sample Page.
Based on these results and the results of the first home network (speed) test, it is decided to include the OpenSpeedTest too.
Conclusions
Based on the measurements below, the following is concluded:
Some speed tests are miscategorized
For this speed test, 6 realistic speed tests, 6 mainstream speed tests and 4 conservative speed tests have been selected.
Based on the test results of the optimal network it is clear that TestMy.net and Meter.net are miscategorized in the past. These speed tests should be categorized as mainstream speed test instead of conservative speed tests.
The categories of speed test should be updated
In 2020 it was concluded that there are three categories of speed tests. However, after seeing the test results based on the optimal network, it seems better to talk about 5 categories of speed tests.
With the requirements for an excellent speed test in mind, it makes sense to categorize the speed test as follows:
- Realistic - The result is in the 109% - 112% range of the advertised speed
- Ambiguous - The result is between realistic and mainstream
- Mainstream - The result is in the 100% - 103% range of the advertised speed
- Conservative - The result is below the advertised speed
- Miscellaneous - The speed test need some improvements
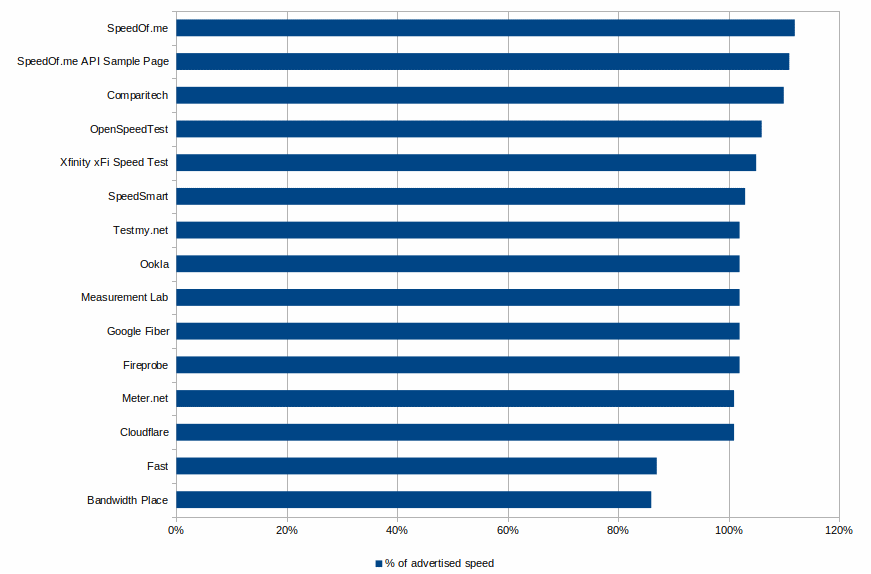
The optimal configuration measurement results indicate that the following categorization applies:
- Realistic
- SpeedOf.me - 112%
- SpeedOf.me API Sample Page - 111%
- Comparitech - 110%
- Ambiguous
- OpenSpeedTest - 106%
- Xfinity xFi Speed Test - 105%
- Mainstream
- SpeedSmart - 103%
- Fireprobe - 102%
- Google Fiber - 102%
- Measurement Lab - 102%
- Ookla - 102%
- Testmy.net - 102%
- Cloudflare - 101%
- Meter.net - 101%
- Conservative
- Fast - 87%
- Bandwidth Place - 86%
How to detect that your wired network is the bottleneck
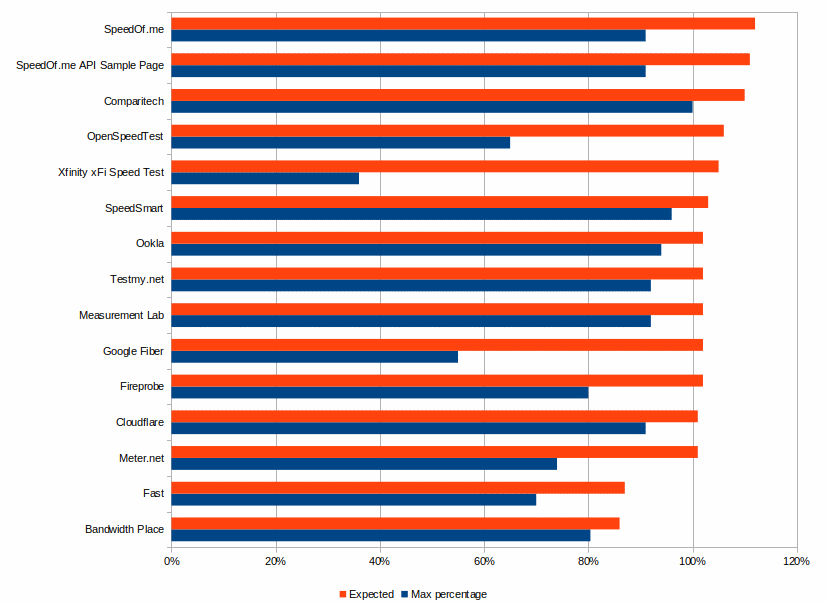
In the graph below you see two download speed percentages per speed test. These percentages are the optimal percentage and the max percentage of a limiting wired home network.

The speed tests with the greatest difference between these percentages are ideal for checking if your wired home network is the bottleneck.
How to detect that your Wi-Fi network is the bottleneck
When your download speed is less than 10-30 Mbps and the advertised speed of your ISP is higher than 30 Mbps you are probably using Wi-Fi g. Wi-Fi g is an older Wi-Fi standard. The maximum download speed is 31.4 Mbps.
Wi-Fi n is a newer standard. The download speed depends on the configuration.
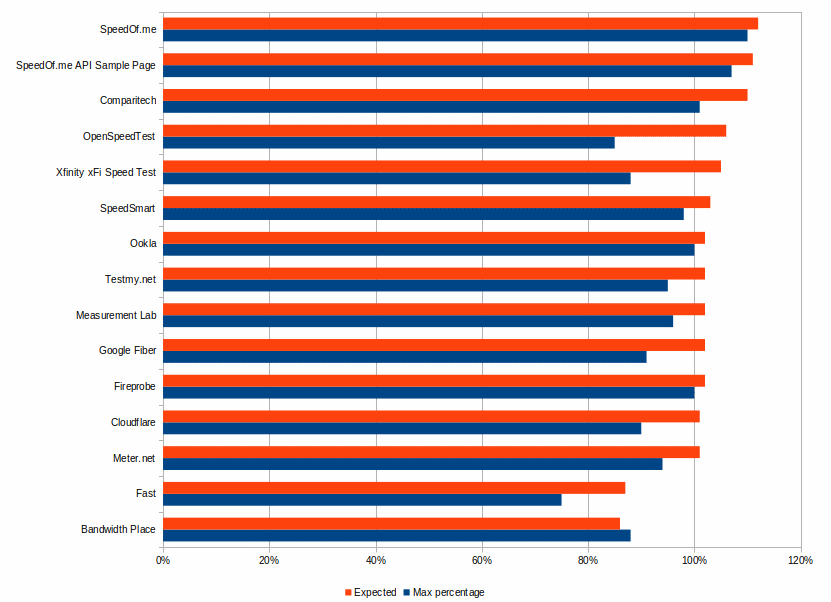
In the graph below you see two download speed percentages per speed test. These percentages are the optimal percentage and the max percentage of a Wi-Fi n home network.

The speed tests with the greatest difference between these percentages are ideal for checking if your Wi-Fi network is the bottleneck.
The measurements
For each configuration, the speed tests are performed 5 times in succession. The median determines the final result.
Note that all measurements are in Mbps.
Optimal wired network
The following download speeds has been measured with the up to date home network and an advertised download speed of 100 Mbps.
Realistic speed tests
- Comparitech 110.05, 110.05, 110.06, 110.11, 110.05. Median: 110.05, Max value: 110.11
- Internet Speed at a Glance 50..100, 100..200, 100..200, 50..100, 50..100
- OpenSpeedTest 105.39, 105.52, 105.43, 105.04, 104.89. Median: 105.39, Max value: 105.52
- SpeedOf.me 111.56, 111.52, 111.56, 111.51, 111.46. Median: 111.52, Max value: 111.56
- SpeedOf.me API Sample Page (only Faster Test) 110.59, 110.01, 110.67, 110.43, 110.51. Median: 110.51, Max value: 110.67
- Xfinity xFi Speed Test 104.5, 103.4, 103.1, 103.0, 104.4. Median: 103.4, Max value: 104.5
Mainstream speed tests
- Cloudflare 101, 101, 101, 101, 102. Median: 101, Max value: 102
- Fireprobe ® 101.96, 101.90, 101.89, 101.20, 101.78. Median: 101.89, Max value: 101.96
- Google Fiber 102, 102, 102, 102, 102. Median: 102, Max value: 102
- Measurement Lab (M-Lab) 101.54, 101.60, 101.44, 101.55, 101.66. Median: 101.55, Max value: 101.66
- Ookla Speedtest 101.82, 101.55, 101.78, 101.89, 101.44. Median: 101.78, Max value: 101.89
- SpeedSmart 103.1, 103.5, 103.4, 100.5, 102.8. Median: 103.1, Max value: 103.5
Conservative speed tests
- Bandwidth Place 95.69, 96.03, 95.87, 95.80, 95.87. Median: 95.87, Max value: 96.03
- Fast 78, 87, 89, 90, 84. Median: 87, Max value: 90
- Meter.net 100.9, 100.9, 100.7, 97.19, 100.8. Median: 100.8, Max value: 100.9
- Testmy.net 98.4, 101.5, 101.6, 101.4, 101.5. Median: 101.5, Max value: 101.6
In the graph below, you see the measured download speeds as percentage of the advertised download speed.

Sweex RO001 (Wired)
The following download speeds has been measured with the Sweex RO001 (Sweex RO001 manual) integrated in the network.
The Sweex RO001 has 4 10/100 Mbps UTP ports. Hence the max download speed is 100 Mbps.
Realistic speed tests
- Comparitech 98.47, 99.1, 97.75, 98.94, 98.02. Median: 98.47, Max value: 99.1
- Internet Speed at a Glance 50..100, 50..100, 50..100, 50..100, 50..100
- OpenSpeedTest 64.19, 61.19, 67.90, 64.49, 60.86. Median: 64.19, Max value: 67.90
- SpeedOf.me 28.13, 25.81, 27.73, 27.56 22.35. Median: 27.56, Max value: 28.13
- SpeedOf.me API Sample Page 28.05, 27.16, 25.06, 26.27, 24.36. Median: 26.27, Max value: 28.05
- Xfinity xFi Speed Test 25.8, 26.2, 23.1, 19.6, 22.4. Median: 23.1, Max value: 26.2
Mainstream speed tests
- Cloudflare 90.7, 90.5, 89.8, 88.6, 90.6. Median: 90.5, Max value: 90.7
- Fireprobe ® 38.20, 36.77, 35.53, 36.77, 37.54. Median: 36.77, Max value: 38.20
- Google Fiber 33.5, 35.0, 34.2, 30.7, 35.5. Median: 34.2, Max value: 35.5
- Measurement Lab (M-Lab) 92.13, 91.15, 92.36, 92.01, 92.41. Median: 92.13, Max value: 92.41
- Ookla Speedtest 93.00, 93.15, 93.69, 93.61, 93.79. Median: 93.61, Max value: 93.79
- SpeedSmart 95.50, 94.99, 94.57, 93.68, 94.45. Median: 94.57, Max value: 95.50
Conservative speed tests
- Bandwidth Place 44.44, 25.88, 40.81, 44.44, 45.45. Median: 44.44, Max value: 45.45
- Fast 70, 68, 49, 62, 63. Median: 63, Max value: 70
- Meter.net 40.81, 42.59, 39.05, 40.11, 36.61. Median: 40.11, Max value: 42.59
- Testmy.net 93, 56.3, 56.3, 41.9, 9.6. Median: 56.3, Max value: 93
Sitecom WL-303 300N Wired
The following download speeds has been measured using a wired Sitecom WL-303 300N router (Sitecom WL-303 300N manual) integrated in the network.
The Sitecom WL-303 300N has four (Auto-Crossover) 10/100 Mbps Fast Switch Ports. Hence the max download speed is 100 Mbps.
Realistic speed tests
- Comparitech 97.92, 98.17, 97.61, 96.37, 98.61. Median: 97.61, Max value: 98.61
- Internet Speed at a Glance 50..100, 50..100, 50..100, 50..100, 50..100
- OpenSpeedTest 61.38, 55.76, 57.18, 57.98, 53.57. Median: 57.18, Max value: 61.38
- SpeedOf.me 22.44, 23.28, 20.63, 22.18, 22.71. Median: 22.44, Max value: 23.28
- SpeedOf.me API Sample Page 21.08, 21.67, 23.24, 24.31, 24.35. Median: 23.24, Max value: 24.35
- Xfinity xFi Speed Test 24.5, 22.7, 25.0, 27.5, 23.0. Median: 24.5, Max value: 27.5
Mainstream speed tests
- Cloudflare 88.3, 86.7, 88.4, 88.9, 88.0. Median: 88.4, Max value: 88.9
- Fireprobe ® 35.10, 38.30, 38.56, 42.27, 34.24. Median: 38.30, Max value: 42.27
- Google Fiber 39.4, 35.6, 34.4, 33.8, 35.8. Median: 35.6, Max value: 39.4
- Measurement Lab (M-Lab) 90.71, 90.67, 90.57, 90.44, 90.60. Median: 90.60, Max value: 90.71
- Ookla Speedtest 89.70, 88.80, 90.70, 90.35, 90.40. Median: 90.35, Max value: 90.70
- SpeedSmart 90.39, 91.63, 91.86, 91.42, 91.80. Median: 91.63, Max value: 91.86
Conservative speed tests
- Bandwidth Place 20.00, 22.58, 19.96, 21.05, 20.29. Median: 20.29, Max value: 22.58
- Fast 61, 62, 63, 63, 61. Median: 62, Max value: 63
- Meter.net 34.57, 34.91, 35.82, 35.11, 33.68. Median: 34.91, Max value: 35.82
- Testmy.net 87.8, 86.9, 89.7, 89.7, 89. Median: 89, Max value: 89.7
Icidu NI-707539 Wired
The following download speeds has been measured using a wired Icidu NI-707539 router (Icidu NI-707539 manual) integrated in the network.
The Icidu NI-707539 has four wired LAN ports (10/100M). Hence the max download speed is 100 Mbps.
Realistic speed tests
- Comparitech 99.84, 99.51, 99.74, 101.23, 101.17. Median: 99.84, Max value: 101.23
- Internet Speed at a Glance 50..100, 100..200, 100..200, 50..100, 50..100
- OpenSpeedTest 63.83, 69.27, 64.74, 65.84, 61.23. Median: 64.74, Max value: 69.27
- SpeedOf.me 26.99, 28.29, 27.99, 27.96, 28.39. Median: 27.99, Max value: 28.39
- SpeedOf.me API Sample Page 28, 26.65, 25.7, 31.49, 23.04. Median: 26.65, Max value: 31.49
- Xfinity xFi Speed Test 26.6, 23.3, 27.4, 24.5, 27.4. Median: 26.6, Max value: 27.4
Mainstream speed tests
- Cloudflare 91.2, 91.7, 92.0, 91.2, 91.0. Median: 91.2, Max value: 92.0
- Fireprobe ® 33.16, 31.39, 31.62, 28.95, 30.43. Median: 31.39, Max value: 33.16
- Google Fiber 35.5, 35.0, 35.0, 30.5, 35.2. Median: 35.0, Max value: 35.5
- Measurement Lab (M-Lab) 92.67, 92.92, 91.80, 92.12, 46.82. Median: 92.12, Max value: 92.92
- Ookla Speedtest 93.87, 93.56, 93.40, 93.56, 93.47. Median: 93.56, Max value: 93.87
- SpeedSmart 95.76, 95.71, 94.95, 95.57, 95.94. Median: 95.71, Max value: 95.95
Conservative speed tests
- Bandwidth Place 23.25, 26.66, 25.31, 24.39, 25.64. Median: 25.31, Max value: 26.66
- Fast 65, 60, 67, 61, 65. Median: 65, Max value: 67
- Meter.net 24.35, 25.04, 34.87, 34.95, 35.18. Median: 34.87, Max value: 35.18
- Testmy.net 93.2, 92.3, 91.9, 93, 92.1. Median: 92.3, Max value: 93.2
Edimax BR-6208AC Wired
The following download speeds has been measured using a wired Edimax BR-6208AC router integrated in the network.
The Edimax BR-6208AC has 4 RJ-45 10/100M LAN ports. Hence the max download speed is 100 Mbps.
Realistic speed tests
- Comparitech 99.24, 99.39, 98.95, 100.12, 100.92. Median: 99.39, Max value: 100.92
- Internet Speed at a Glance 50..100, 100..200, 100..200, 50..100, 50..100
- OpenSpeedTest 59.57, 63.46, 43.40, 59.36, 60.00. Median: 59.57, Max value: 63.46
- SpeedOf.me 25.01, 26.23, 25.84, 26.05, 26.09. Median: 26.05, Max value: 26.23
- SpeedOf.me API Sample Page 25.49, 25.87, 26.61, 23.87, 24.51. Median: 25.49, Max value: 26.61
- Xfinity xFi Speed Test 20.7, 23.2, 21.4, 20.4, 22.9. Median: 21.4, Max value: 23.2
Mainstream speed tests
- Cloudflare 89.3, 87.5, 88.6, 89.2, 87.8. Median: 88.6, Max value: 89.3
- Fireprobe ® 40.65, 38.24, 37.84, 37.38, 39.53. Median: 38.24, Max value: 40.65
- Google Fiber 32.9, 32.8, 35.9, 38.3, 31.0. Median: 32.9, Max value: 38.3
- Measurement Lab (M-Lab) 92.72, 91.26, 91.31, 91.88, 92.44. Median: 91.88, Max value: 92.72
- Ookla Speedtest 93.14, 93.52, 93.88, 94.57, 92.99. Median: 93.52, Max value: 94.57
- SpeedSmart 94.45, 95.05, 95.65, 94.99, 94.7. Median: 94.99, Max value: 95.65
Conservative speed tests
- Bandwidth Place 34.48, 20.08, 32.25, 19.88, 20.00. Median: 20.08, Max value: 34.48
- Fast 60, 69, 66, 45, 56. Median: 60, Max value: 69
- Meter.net 37.52, 42.19, 39.47, 37.56, 37.45. Median: 37.56, Max value: 42.19
- Testmy.net 92.7, 91.2, 92.1, 92.9, 92.1. Median: 92.1, Max value: 92.9
Sitecom WL-303 300N Wi-Fi n
The following download speeds has been measured using a Sitecom WL-303 300N router (Sitecom WL-303 300N manual) which only supports the 802.11n standard at the 2.4GHz range.
Realistic speed tests
- Comparitech 67.01, 65.82, 67.75, 68.90, 68.68. Median: 67.75, Max value: 68.90
- Internet Speed at a Glance 50..100, 50..100, 50..100, 50..100, 50..100
- OpenSpeedTest 50.17, 40.88, 43.35, 47.39, 47.79. Median: 47.39, Max value: 50.17
- SpeedOf.me 16.18, 20.35, 20.63, 20.33, 20.83. Median: 20.35, Max value: 20.83
- SpeedOf.me API Sample Page 19.46, 20.18, 21.75, 21.74, 22.1. Median: 21.74, Max value: 22.1
- Xfinity xFi Speed Test 14.4, 16.1, 13.0, 13.5, 14.7. Median: 14.4, Max value: 16.1
Mainstream speed tests
- Cloudflare 60.5, 61.6, 62.8, 59.9, 59.0. Median: 60.5, Max value: 62.8
- Fireprobe ® 35.19, 34.83, 33.31, 33.48, 32.21. Median: 33.48, Max value: 35.19
- Google Fiber 34.6, 33.8, 35.3, 30.3, 32.5. Median: 33.8, Max value: 35.3
- Measurement Lab (M-Lab) 61.82, 63.79, 63.10, 63.08, 62.92. Median: 63.08, Max value: 63.79
- Ookla Speedtest 61.48, 60.86, 59.90, 60.67, 60.58. Median: 60.67, Max value: 61.48
- SpeedSmart 52.56, 56.78, 60.27, 58.66, 59.06. Median: 58.66, Max value: 60.27
Conservative speed tests
- Bandwidth Place 27.39, 19.80, 19.70, 29.85, 28.57. Median: 27.39, Max value: 29.85
- Fast 37, 42, 40, 40, 38. Median: 40, Max value: 42
- Meter.net 24.80, 25.79, 25.61, 20.54, 21.54. Median: 24.80, Max value: 25.79
- Testmy.net 2, 68, 27.1, 29.6, 61.7. Median: 29.6, Max value: 68
Sitecom N600 X5 Wi-Fi n
The following download speeds has been measured using a Sitecom N600 X5 router (Sitecom N600 X5) which only supports the 802.11n standard at the 2.4GHz range.
Realistic speed tests
- Comparitech 96.55, 98.52, 104.58, 100.90, 103.63. Median: 100.90, Max value: 104.58
- Internet Speed at a Glance 50..100, 50..100, 50..100, 50..100, 50..100
- OpenSpeedTest 71.69, 86.73, 86.71, 84.68, 85.49. Median: 85.49, Max value: 86.73
- SpeedOf.me 110.19, 102.12, 101.94, 106.21, 105.86. Median: 105.86, Max value: 110.19
- SpeedOf.me API Sample Page 101.54, 98.95, 109.61, 107.3, 107.84. Median: 107.3, Max value: 109.61
- Xfinity xFi Speed Test 86.8, 94.1, 91.0, 88.3, 78.8. Median: 88.3, Max value: 94.1
Mainstream speed tests
- Cloudflare 85.9, 90.0, 86.5, 97.1, 90.4. Median: 90.0, Max value: 97.1
- Fireprobe ® 102.25, 100.05, 100.25, 100.20, 100.20. Median: 100.20, Max value: 100.25
- Google Fiber 89.5, 90.5, 102, 101, 84.9. Median: 90.5, Max value: 102
- Measurement Lab (M-Lab) 96.88, 95.73, 94.79, 97.79, 95.72. Median: 95.73, Max value: 97.79
- Ookla Speedtest 100.69, 100.00, 96.58, 98.36, 100.34. Median: 100.00, Max value: 100.69
- SpeedSmart 97.93, 98.81, 90.11, 97.05, 101.3. Median: 97.93, Max value: 101.3
Conservative speed tests
- Bandwidth Place 93.24, 87.52, 88.39, 89.88, 85.37. Median: 88.39, Max value: 93.24
- Fast 71, 81, 88, 74, 75. Median: 75, Max value: 88
- Meter.net 95.81, 92.10, 94.10, 91.43, 96.72. Median: 94.10, Max value: 96.72
- Testmy.net 93.7, 95.2, 95.9, 94, 97.7. Median: 95.2, Max value: 97.7
Icidu NI-707539 Wi-Fi n
The following download speeds has been measured using a Icidu NI-707539 router (Icidu NI-707539 manual) which only supports the 802.11n standard at the 2.4GHz range.
Realistic speed tests
- Comparitech 93.83, 93.94, 89.66, 97.01, 97.81. Median: 93.94, Max value: 97.81
- Internet Speed at a Glance 50..100, 50..100, 20..50, 50..100, 20..50
- OpenSpeedTest 54.77, 53.87, 54.90, 52.71, 57.09. Median: 54.77, Max value: 57.09
- SpeedOf.me 18.22, 18.02, 18.25, 18.34, 17.68. Median: 18.22, Max value: 18.34
- SpeedOf.me API Sample Page 17.17, 17.93, 18.66, 17.4, 18.44. Median: 17.93, Max value: 18.66
- Xfinity xFi Speed Test 13.9, 14.4, 13.2, 13.7, 10.3. Median: 13.7, Max value: 14.4
Mainstream speed tests
- Cloudflare 81.4, 81.0, 64.4, 83.9, 81.0. Median: 81.0, Max value: 83.9
- Fireprobe ® 28.67, 30.49, 29.50, 27.86, 28.86. Median: 28.86, Max value: 30.49
- Google Fiber 19.6, 25.0, 20.3, 21.5, 22.2. Median: 21.5, Max value: 25.0
- Measurement Lab (M-Lab) 80.90, 75.14, 81.26, 78.29, 84.52. Median: 80.90, Max value: 84.52
- Ookla Speedtest 86.72, 92.93, 92.73, 91.61, 91.10. Median: 91.61, Max value: 92.93
- SpeedSmart 92.67, 90.03, 95.21, 94.70, 93.51. Median: 93.51, Max value: 95.21
Conservative speed tests
- Bandwidth Place 15.74, 16.09, 16.64, 15.44, 17.09. Median: 16.09, Max value: 17.09
- Fast 44, 39, 40, 41, 38. Median: 40, Max value: 44
- Meter.net 18.84, 18.97, 18.91, 19.44, 18.59. Median: 18.91, Max value: 19.44
- Testmy.net 76.2, 73.4, 74.3, 73.6, 72. Median: 73.6, Max value: 76.2
Edimax BR-6208AC Wi-Fi b/g/n
The following download speeds has been measured using a Edimax BR-6208AC router which supports the 802.11b/g/n standard at the 2.4GHz range.
Realistic speed tests
- Comparitech 98.75, 96.83, 97.95, 95.77, 95.09. Median: 96.83, Max value: 98.75
- Internet Speed at a Glance 50..100, 100..200, 100..200, 50..100, 50..100
- OpenSpeedTest 49.43, 52.49, 51.09, 55.51, 55.30. Median: 52.49, Max value: 55.30
- SpeedOf.me 19.59, 21.24, 22.21, 21.57, 20.96. Median: 21.24, Max value: 22.21
- SpeedOf.me API Sample Page 18.45, 18.67, 18.17, 17.73, 18.22. Median: 18.22, Max value: 18.67
- Xfinity xFi Speed Test 18.2, 21.3, 21.2, 16.8, 16.7. Median: 18.2, Max value: 21.3
Mainstream speed tests
- Cloudflare 85.9, 58.4, 85.0, 84.1, 85.7. Median: 85.0, Max value: 85.9
- Fireprobe ® 34.54, 32.47, 31.78, 32.17, 32.10. Median: 32.17, Max value: 34.54
- Google Fiber 19.5, 29.7, 31.3, 30.3, 30.5. Median: 30.3, Max value: 31.3
- Measurement Lab (M-Lab) 80.10, 80.17, 84.03, 84.31, 83.86. Median: 83.86, Max value: 84.31
- Ookla Speedtest 33.31, 24.96, 25.64, 32.32, 29.12. Median: 29.12, Max value: 33.31
- SpeedSmart 93.97, 92.63, 92.23, 92.10, 93.78. Median: 92.63, Max value: 93.97
Conservative speed tests
- Bandwidth Place 19.41, 19.27, 19.45, 18.69, 18.82. Median: 19.27, Max value: 19.45
- Fast 42, 48, 50, 42, 44. Median: 44, Max value: 50
- Meter.net 23.99, 18.02, 24.22, 24.74, 21.72. Median: 23.99, Max value: 24.74
- Testmy.net 80.4, 86.4, 90.8, 86.3, 81.3. Median: 86.3, Max value: 90.8
Wi-Fi g
The following download speeds has been measured using a Sitecom N600 X5 router (Sitecom N600 X5) which only supports the 802.11g standard at the 2.4GHz range.
At the Wikipedia page 802.11g it is stated that: 802.11g (...) operates at a maximum raw data rate of 54 Mbit/s. Using the CSMA/CA transmission scheme, 31.4 Mbit/s is the maximum net throughput possible (...)
Hence the max download speed is 31.4 Mbps.
Realistic speed tests
- Comparitech 8.76, 18.11, 9.97, 3.74, 17.30. Median: 9.97, Max value: 18.11
- Internet Speed at a Glance 20..50, 20..50, 20..50, 20..50, 20..50
- OpenSpeedTest 19.77, 19.24, 20.31, 20.55, 20.32. Median: 20.31, Max value: 20.55
- SpeedOf.me 28.9, 28.71, 27.82, 28.84, 28.05. Median: 28.71, Max value: 28.9
- SpeedOf.me API Sample Page 28.09, 28.28, 28.22, 28.97, 29.02. Median: 28.28, Max value: 29.02
- Xfinity xFi Speed Test 24.0, 26.6, 21.8, 18.7, 25.0. Median: 24.0, Max value: 26.6
Mainstream speed tests
- Cloudflare 25.7, 25.3, 25.3, 24.3, 25.1. Median: 25.3, Max value: 25.7
- Fireprobe ® 25.94, 25.70, 25.72, 25.58, 26.05. Median: 25.72, Max value: 26.05
- Google Fiber 25.4, 23.4, 23.4, 24.7, 24.3. Median: 24.3, Max value: 25.4
- Measurement Lab (M-Lab) 25.25, 25.69, 25.45, 25.62, 24.78. Median: 25.25, Max value: 25.69
- Ookla Speedtest 26.46, 25.02, 24.75, 25.54, 25.54. Median: 25.54, Max value: 26.46
- SpeedSmart 23.03, 22.67, 22.77, 22.90, 23.50. Median: 22.90, Max value: 23.50
Conservative speed tests
- Bandwidth Place 24.92, 25.19, 25.29, 25.07, 24.31. Median: 25.07, Max value: 25.29
- Fast 22, 24, 22, 21, 20. Median: 22, Max value: 24
- Meter.net 24.87, 24.51, 25.18, 24.64, 25.92. Median: 24.87, Max value: 25.92
- Testmy.net 24.3, 23.7, 24.7, 24.4, 24.4. Median: 24.4, Max value: 24.7
Based on these results, it is clear that none of these speed tests is able to measure the maximum download speed correctly.

The best speed tests for measuring your download speed, when you use Wi-Fi g, are SpeedOf.me and the SpeedOf.me API Sample Page.