After 5 years of testing speed tests, we were confident enough to develop a generic standardized test for testing speed tests.
The purpose of this standardized test is to get a good objective impression of the qualities of the speed test in question with as few measurements as possible.
This is because we wanted to test many more speed tests than we have been able to test so far.
An additional advantage of standardized testing is that we can now easily compare the speed tests on the different quality attributes.
Quality attributes
We recognize the following quality attributes:
For each quality attibute we calculate a score in the range 0 - 100, where 100 is best.
Based on these quality attributes we calculate an Overall score in the range 0 - 5 stars.
Below we explain how the scores for the quality attributes and the overall score are calculated.
Accuracy
Which speed test is most accurate depends on the measured speed.
Note that we initial test the speed tests with an adverstised speed of 100 Mbps.
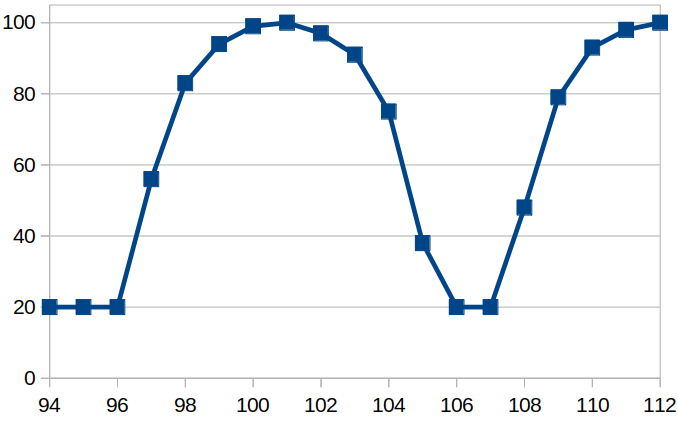
When a speed test measure a value less the 95% of the advertised speed then the accuracy score is 20.
With an advertised speed of 100 Mbps, we know that the to be measured speed is 100.8 Mbps and that the true internet speed is 112 Mbps.
To calculate the accuracy score we first calculate the average of three measurements. We then determine the-smallest-absolute-deviation between this calculated average and the internet speed to be measured (100.8 Mbps) and the true internet speed (112 Mbps).
Our formula for the accuracy score is: 100 - the-smallest-absolute-deviation * 1.9 ^ the-smallest-absolute-deviation
We now use also a minumum accuracy score of 20.
The graph below shows the relation between the measured speed in Mbps and the corresponding accuracy score.
Data efficiency
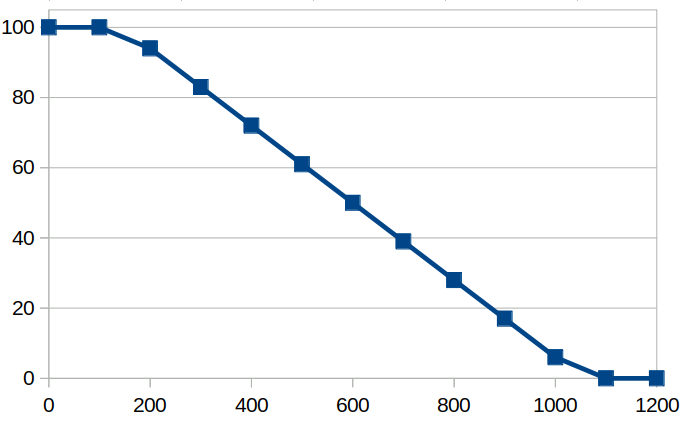
Data efficiency is inversely proportional to the amount of data required to run a speed test.
We determine the amount of data needed by running the speed test 3 times, measuring the total amount of data used with the live option of vnstat.
For the formula (of the line), we use the test results based on our original list of speed tests. This shows that the median is 600 MiB. We give this a score of 50. We think it's realistic to assign a score of 100 to speed tests that require 150 MiBs or less (for 3 speed tests).
This results in the graph below, which shows the relation between the MiB's used (for 3 speed tests) and the corresponding data efficiency score.
Time to complete
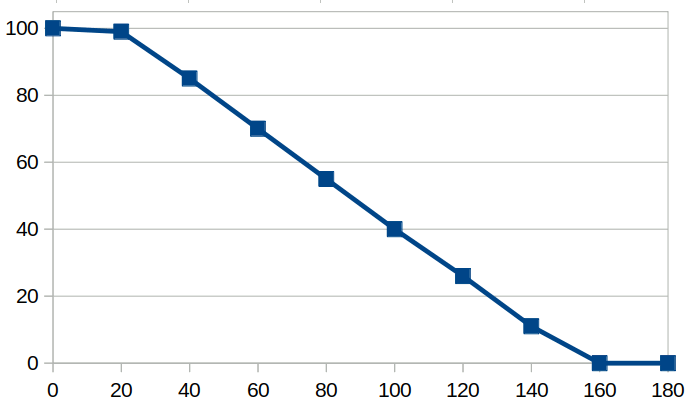
The time to complete score is inversely proportional to the time to complete.
We determine the time to complete by running the speed test 3 times and measure the total time required.
For the formula (of the line), we use the test results based on our original list of speed tests. This shows that the median is 87 seconds. We give this a score of 50. We think it's realistic to assign a score of 100 to speed tests that require 19 seconds or less (for 3 speed tests).
This results in the graph below, which shows the relation between the time used (for 3 speed tests) and the corresponding time to complete score.
Security
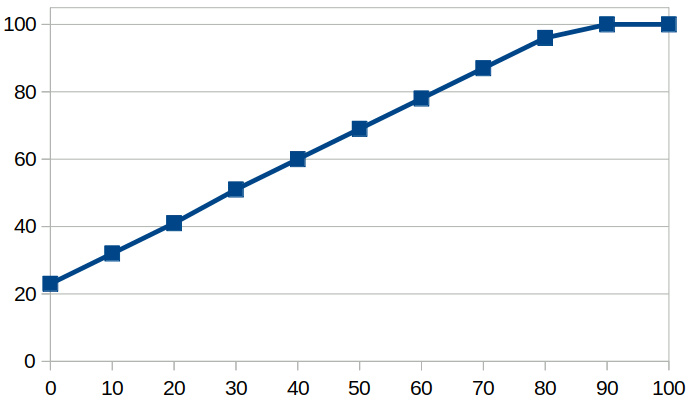
The security score is related to The HTTP Observatory score. This is because the Observatory's score best matches the results of our previous security research.
For the formula (of the line), we use the test results based on our original list of speed tests. This shows that the median is 25 and the maximum is 80.
Note that we lower the security score with 4 for the median and the max score. This way there is still some room for improvement.
This results in the graph below, which shows the relation between security score and the corresponding observatory score.
Privacy friendly
The privacy friendly score is based on:
- the number of cookies
- whether the speed test is ad-free
- the readability of the privacy policy
First we normalize the scores for these factors. The median of cookies is 6, the least number of cookies is 0. When a speed test is ad-free the score is 100, otherwise the score is 0. The readability of the privacy policy is measured with the Readability Calculator. We only note the Flesch Reading Ease score. The median is 34.91, while the max score is 47,91. Note that we lower our scores with 10, to create some room for improvement.
By using a weighted average we arrive at one final score. The cookie score counts for 55%, being ad-free counts for 30% and the readability of the privacy policy counts for 15%.
These factors plus associated weights were chosen because the results best correspond to our previous privacy testing.
Because the privacy score depends on several factors, we cannot simply show a graph that shows the relationship between the input and the privacy-friendly score.
Usability
The usability score is based on:
- the back-button behavior
- the possibility to abort a running speed test
- whether the speed test is ad-free
First we normalize the scores for these factors. When you are able to go back to webpage from which you browsed to the speed test with 1 click at the backbutton the score is 100, otherwise the score is 0. When you are able to abort or pause a running speed test the score is 100, otherwise the score is 0. When a speed test is ad-free the score is 100, otherwise the score is 0.
By using a weighted average we arrive at one final score. The back-button behavior counts for 20%, the possibility to abort a running test counts for 50% and being ad-free counts for 30%.
These factors plus associated weights were chosen because the results best correspond to our previous usability testing.
Because the privacy score depends on several factors, we cannot simply show a graph that shows the relationship between the input and the usability score.
Accessibility
As mentioned at the page The most accessible speed test combining accessibility tests like AChecker, Tingtun's pagecheck and WAVE gives a good idea of whether a web page is actually accessible.
For this standarized test we also check whether there is a clear indication of the current focus.
First we normalize the scores for these factors. For AChecker the minimum number of known problems is 0 and the median is 6 known problems, for Tingtun the maximum score is 100 and the median is 95.74 and for WAVE is the minimum number of errors 0 and the median is 2 errors. When a speed test has a clear indication of the current focus the score is 100, otherwise the score is 0.
By using a weighted average we arrive at one final score. The online accessibility tests count for 32%, the indication of the current focus counts for 4%.
These factors plus associated weights were chosen because the results best correspond to our previous accessibility tests.
Because the accessibility score depends on several factors, we cannot simply show a graph that shows the relationship between the input and the accessibility score.
Informative
To determine how informative a speed test is, we count the number of informative items besides the download speed. The score starts a 20.
For each of the following informative items 10 points are added to the informative score:
- Total progress indicator
- Progress indicator per test
- Maximum download speed
- Graph download speed
- Upload speed
- Maximum upload speed
- Graph upload speed
- Ping time / Latency
- Jitter
Overall score
The above scores count towards the total score, with the following percentages:
- Accuracy: 45%
- Data efficiency: 10%
- Time to complete: 15%
- Security: 5%
- Privacy friendly: 10%
- Usability: 5%
- Accessibility: 5%
- Informative: 5%
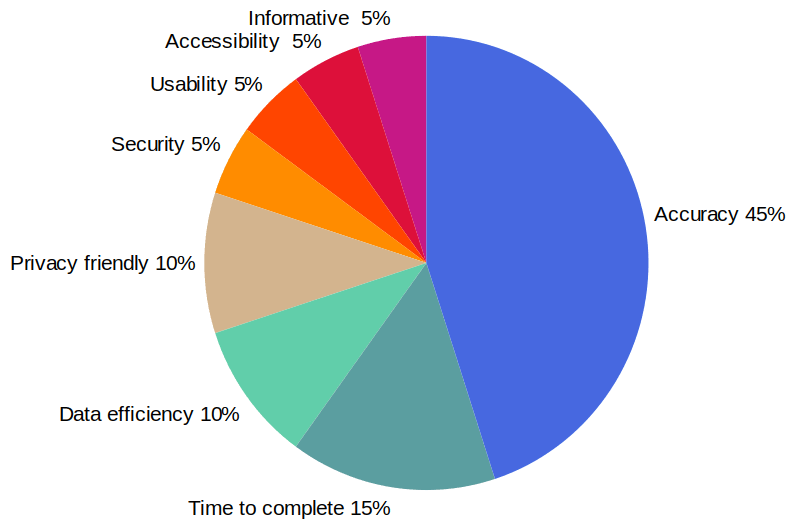
The percentages we use make it clear which aspects we consider important in a speed test.
We want an overall score of max 5 stars. Hence we divide the overall score by 20.
Because the best speed tests currently do not yet achieve 5 stars, we increase the score by 19%. As a result, the best speed tests in our opinion get 5 stars instead of 4 stars.
We apply this standard test to all speed tests that we test.
Speed tests used for calibrating
For calibrating this standardized speed test test we used the test results of the following speed tests:
- Astound
- Bandwidth Place
- Bredbandskollen
- Broadband Speed Checker
- Cloudflare
- Comparitech
- DSLReports
- Fast
- Fireprobe
- Google Fiber
- Internet Speed at a Glance
- LibreSpeed
- Meter.net
- M-Lab
- nPerf
- Ookla Speedtest
- OpenSpeedTest™
- Samknows
- Speedcheck™
- SpeedOf.me
- SpeedOf.me API sample page
- SpeedSmart
- Speedtest4.php
- TestMy.net
- Toast
- Which Broadband Checker
- Xfinity Speed Test
Note that the above list is based on this list of unique speed tests.